Windoes7 - "low physical memory"

NeilF

Registered user
Joined
Sep 23, 2002
Messages
1,355
Reaction score
3
Location
officially THE best place to live . . . . Wokingha
5 month old HP Pavilion, 4G memory, TBs of storage, Windows7, Office 2010.

When the puter sits at idle the available physical memory just disappears, meaning the programs take ages to shut down or open e.g. 4 minutes to log-off; 3 minutes to open Word!

I've looked at Resources / Services / Applications runing but there's nothing that suggests anything is running off with CPU cycles (I know, CPU cycles and storage are different!) - or even running sometimes!.

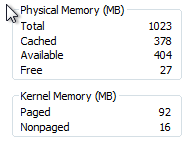
It looks to me as if the puter is 'paging' out to disk rather than retaining within the 4G of memory; the disk activity light is on permanently whenever I have this problem, and the services screen is showing 0 free MBytes (again, I know about committed vs available vs free memory).

Anyone else experiencing this problem? It's like having the slowest, oldest computer you've ever experienced!


Cheers,

Neil.
 
If you look at processes with task manager, can you see which one is grabbing huge amounts of memory?

Type "msconfig" in the search progs.... box, then press return, when the system configuration utility starts, click the startup tab to see what starts at boot time.

Do you see the same name(s) in both?
 
fire it up in safe mode to see if it runs ok.... suggest doing a virus check as some nasty little blighters take your memory but hides itself as a legit program...
 
If you look at processes with task manager, can you see which one is grabbing huge amounts of memory?

Explorer.exe has 20M, MediaTVMonitor.exe*32 has 21M, and the firewall 13M. All the other 54 processes are around 2 - 6M.

Type "msconfig" in the search progs.... box, then press return, when the system configuration utility starts, click the startup tab to see what starts at boot time.
Under msconfig / startup there are just 8 processes - firewall, hp support, MediaTVMonitor, and NVIDIA.

The problem isn't at start-up, more like when it has been sat idling for some time - then it just deteriorates irrecoverably. Pretty sure it isn't a virus as I run Webroot AV and Firewall.

Thanks for your inputs so far.

Cheers,

Neil.
 
Explorer.exe has 20M, MediaTVMonitor.exe*32 has 21M, and the firewall 13M. All the other 54 processes are around 2 - 6M.


Under msconfig / startup there are just 8 processes - firewall, hp support, MediaTVMonitor, and NVIDIA.

The problem isn't at start-up, more like when it has been sat idling for some time - then it just deteriorates irrecoverably. Pretty sure it isn't a virus as I run Webroot AV and Firewall.

Thanks for your inputs so far.

Cheers,

Neil.

Some poorly written programmes are not good at releasing memory when they've finished with it, and tend to grab a new chunk every time they do something. Windows 7 was meant to be better at managing this sort of memory leak problem, but it does sounds like this is what is causing your free memory to vanish. The programme only reports the memory it us using at the time.

Can you try booting in safe mode, leave the machine to sit for a bit, and see if the memory keeps disappearing? If it doesn't then you know one of the programmes you've listed might be the culprit, so use msconfig to stop a programme from starting, then re-start in normal mode and see what happens. I'd start with the TV programme, then try hpsupport.

What firewall are you using, the windows one?

You say there are eight processes, but only list four, what are the others?
 
The problem with the task manager is it only shows the commit level for user processes, and doesn't include other stuff like the kernel pools and disk cache.
Commit is the size that a process could be, but it depends on whether the pages are in memory or have been evicted to the page file.

If any of these programs load a leaky driver you'll not see it in the task manager.

Flip over to the performance tab in the W7 task manager to see how much physical memory is given to the cache, and paged/nonpaged kernel pools out of the total you have e.g...
 

Attachments

  • Screen shot 2011-03-24 at 14.43.11.png
    Screen shot 2011-03-24 at 14.43.11.png
    7.6 KB · Views: 117
Hi Neil,
+1 for booting in safe mode and letting it sit for a while, as a first step.

To get a lot more info about processes than Windows Task Manager, I use a free utility called Process Explorer:
http://technet.microsoft.com/en-us/sysinternals/bb896653
which shows the vendor, purpose of the process, and any child or parent processes. If you hover over the name of a process, you can see its command line (i.e. where it was started from) and which Windows services it is providing (especially useful for generic service processes like svchost.exe)

Clicking on any column title sorts by that column, and clicking the column title again sorts by that column in the opposite order (just like in Task Manager), so you can use the memory columns (private bytes or working set) to watch and see if any process is using or claiming a lot of memory.

So if it's working OK in Safe mode, try a regular restart and monitor physical memory usage for a while. (Sorry if you've tried this already)

Just my 5C - hope it helps :type
 
The problem with the task manager is it only shows the commit level for user processes, and doesn't include other stuff like the kernel pools and disk cache.
Commit is the size that a process could be, but it depends on whether the pages are in memory or have been evicted to the page file.

If any of these programs load a leaky driver you'll not see it in the task manager.

Flip over to the performance tab in the W7 task manager to see how much physical memory is given to the cache, and paged/nonpaged kernel pools out of the total you have e.g...

Boot from Safe Mode for 90 minutes idling:
start end
Total 3839 > 3839
Cached 479 > 578
Available 2828 > 3212
Free 2432 > 2778

Paged 122 > 122
Nonpaged 35 > 24

Processes 22 > 23
CPU usage 0% > 0%
Physical
memory 26% > 16%


Boot from Normal Mode for 90 minutes idling:
start end
Total 3839 > 3839
Cached 588 > 957
Available 2695 > 953
Free 2213 > 0

Paged 162 > 2761
Nonpaged 40 > 777

Processes 60 > 60
CPU usage 5% > 25%
Physical
memory 30% > 75%

So, it looks like I have a "leaky program or driver"?

What would you sugest I do next?

I'll try Shugie's suggestion of turning off the TVMonitor and hpsupport programs and restart in normal mode to see if there's an improvement.


Thanks so far guys!
 
Nice work.

Uninstlall the tv software and repeat the monitoring.

actually, The cache grew a bit too. Does the tv software open a big file and write to it for instant replay. With big HDs you might just run out of memory to manage the file that's open before the disk fills. You could try disabling any file for the tuner first, before disabling the program.

Ian
 
Uninstlall the tv software and repeat the monitoring.

actually, The cache grew a bit too. Does the tv software open a big file and write to it for instant replay?
Ian

Well, I don't have a television attached to the computer . . . but just hold that thought for a second.

I re-booted with "MediaTVMonitor" deselected from msconfig. Task Manager ran 90 minutes with the free memory changing from 2242 to 1490MB, but the physical memory being just 24% (down from 31% at startup).

I then googled "MediaTVMonitor" - it's "a dangerous .exe virus" pointing back to www.js.tongji.linezing.com! Feck me - is this the cause of me getting those spam emails from China this last week??? Top marks to Shugie for suggesting the link between my computer performance and the spam emails :clap

I noticed that my Webroot anti-spyware had automatically blocked that program from trying to access the Chinese site.

I'm now running RegZooka to clear the registrys, etc, and I'll then run webroot Spysweeper to double check.

Interestingly, I can't find "MediaTVMonitor" as a program to deinstal. I'll do a sperate search for it in StartUp Programs, and report my progress.

What a great website this UKGS site is - thanks guys!

Cheers,

Neil.

I'd suggest when booted in safe mode you search for any file mediatvmonitor.* then delete it. Also find a bootable anti-virus to scan the whole disk without starting windows, any of these, athough Avira is the one I generally use.

http://www.techmixer.com/free-bootable-antivirus-rescue-cds-download-list/
 
After examining all the information and logs you returned to us, I cannot locate any traces of an infection on your machine, it appears that your computer is clean.
The alert you are getting is probably from an ad or a frame on a web site that has been compromised (SQL injected) and not from anything on your computer.

Thanks,
Chuck
Malware Removal Engineer
-Webroot Advanced Malware Removal Team


Back
Top Bottom